Kinematic Diagram:

Mobility calculation:

Note that the result from Gruebler's equation gives 2 degrees of freedom, but this is assuming that the two input linkages, links 2 and 5, are independent. However, in the geared five-bar mechanism, the motion of link 5 is directly linked to the motion of link 2 by the gear, with the relationship defined by the phase angle phi and the gear ratio lambda. Thus, the actual number of degrees of freedom is one.
Manual position, velocity, and acceleration analysis: (Based on equations provided in Design of Machinery)

The resulting equations for position, angular velocity, and angular acceleration were put into a MATLAB script along with all the relevant constants. From here, I was able to create an animation of the mechanism, as well as the various plots shown below.
In the animation below, the cyan and magenta circles represent the path of the input links as they turn on their respective gears. The yellow circle represents the rotating platter. The path of the pen is plotted in green, showing the position of point P on the mechanism as the pen completes one period, or 3 full revolutions of the input link.

Below are some plots of the linear position, velocity, and acceleration of the pen as it moves. Note that these plots do not take into account the rotation of the paper on the platter; the plots reflect the movement of the pen only.


Figure 11. Linear Position, Velocity, and Acceleration of Pen.
The plots below show the same data, but plotted with respect to the angle of the input link, theta2.
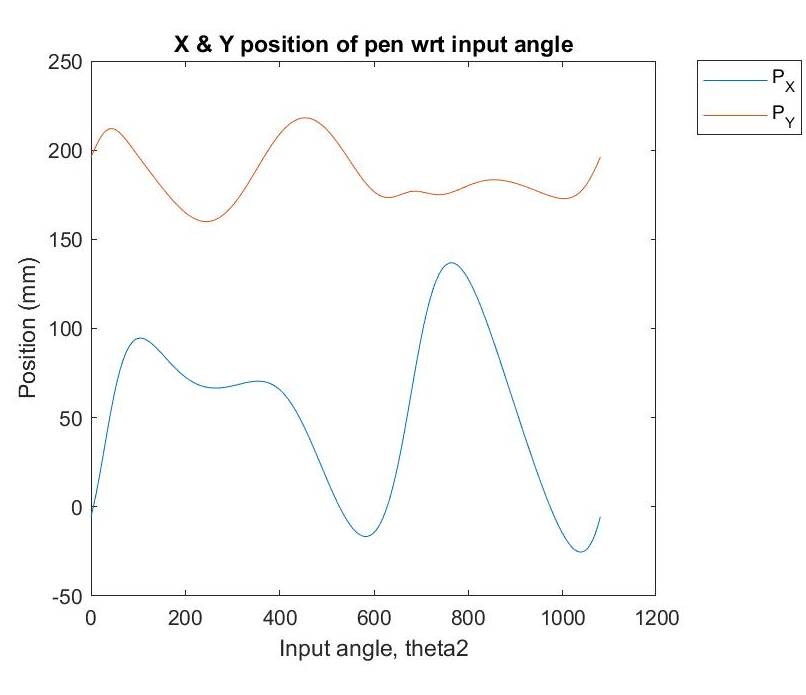


Figure 12. Linear Position, Velocity, and Acceleration of Pen with respect to theta_2.
Next are some plots of the angular motion of link 3, to which the pen is fixed in the model. This motion is plotted with respect to the angle of the input link, theta_2.

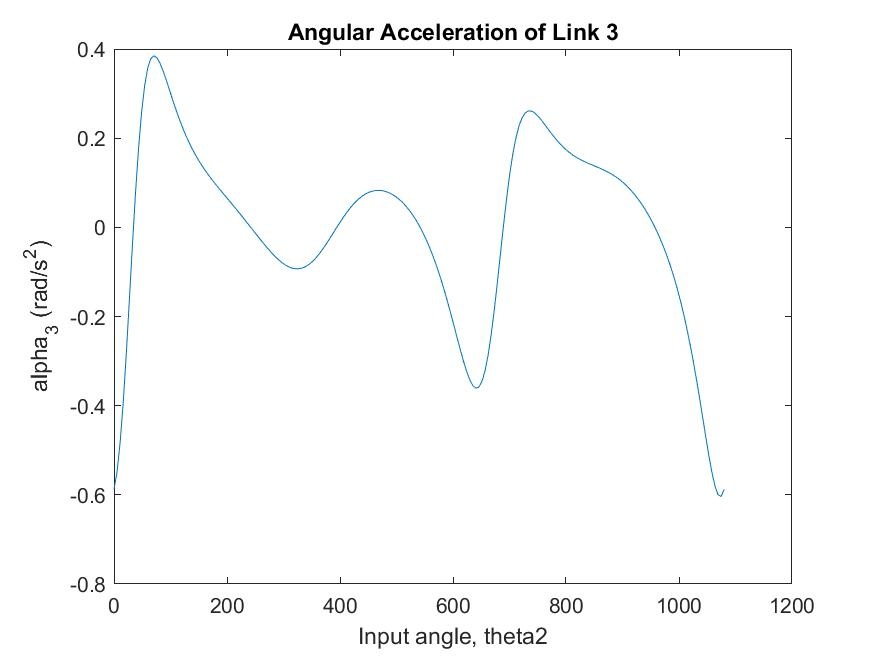
Figure 13. Angular velocity and acceleration of link 3.
Now, I wanted to incorporate the rotation of the paper on the platter, to get a full simulation of the path of the pen in the prototype. I also wanted to see how the results from the simulation matched up with those of the prototype. To get similar results from the prototype and the simulation, a relationship must first be established between the rotation of the platter and the rotation of the input link. In the prototype, this was a relatively simple task: the speed of the stepper motor was programmed in the Arduino code, and the speed of the DC motor varied roughly linearly with the input voltage. Thus, I was able to get a ratio of the RPM value of the DC motor to the RPM value of the stepper motor. To match this relationship in the simulation, I programmed the ratio between the input link's and the platter's total rotation in degrees to match the RPM ratio from the motors. Since the program runs for a fixed number of iterations, the different total rotation values for the platter and input link were each divided into an equal number of partitions, thus ensuring that the relationship was roughly equal between the prototype and the simulation.

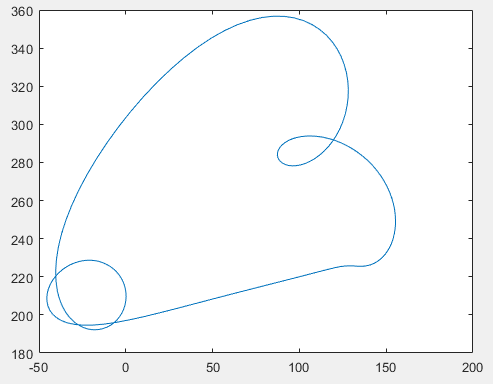
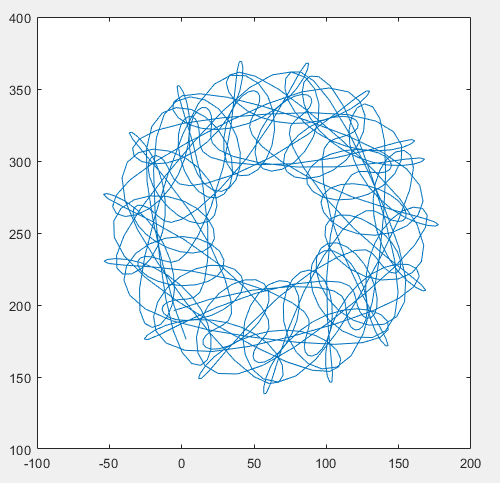
Figure 14. Simulation and Prototype results for 3:1 ratio between input link and platter.
A video of the prototype and the animation are also available above for the 3:1 ratio between the input link speed and the platter speed. Note that in the prototype, this ratio was accomplished by using the small 12-tooth gear between the input gear and the platter, which inherently have a 1:3 gear ratio. Thus, when linked via the 12-tooth gear, the speed reduction from the input gear to the platter is 1:3. As one can see from the images, the pattern from the prototype and simulation match up reasonably well. I believe the discrepancies between the two patterns can be explained by the gear ratio in the prototype not being precisely 3:1 due to inaccuracies in the speed of the DC motor.
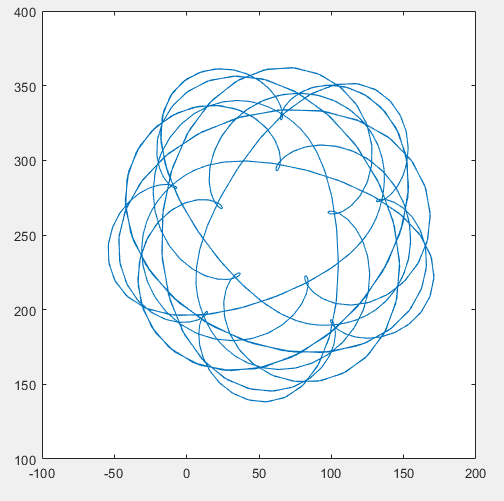
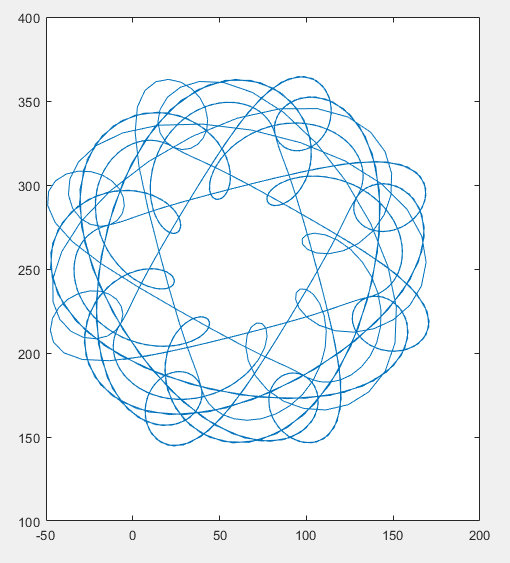
Here are some more patterns the simulation has drawn: