Overview
There are many software packages that are used in RIP-seq analysis - here are some of the most common choices:

Li Y, Zhao DY, Greenblatt JF, Zhang Z. RIPSeeker: a statistical package for identifying protein-associated transcripts from RIP-seq experiments. Nucleic Acids Res. 2013;41(8):e94.
DESeq, edgeR, and Cuffdiff
For RIP-seq protocols where the entire transcript gets pulled down, analysis proceeds very similarly to a general differential expression experiment. You have already seen some details about DESeq and edgeR, and both can be used for RIP-seq analysis, preferably by comparison to another IP experiment. Cuffdiff different primarily from DESeq and edgeR not in the statistical test it uses (though it can vary in that regard depending on its settings), but based on how it estimates transcript abundance:

Trapnell C, Hendrickson DG, Sauvageau M, Goff L, Rinn JL, Pachter L. Differential analysis of gene regulation at transcript resolution with RNA-seq. Nat Biotechnol. 2013;31(1):46-53.
This process is easier when cufflinks is used to assemble a transcriptome, since that will ensure that most reads can be mapped onto a shared assembly with the features being tested for differential expression, but cufflinks is not essential to run cuffdiff. All we need (as we will see next section) is a feature file and a set of alignment (SAM/BAM) files.
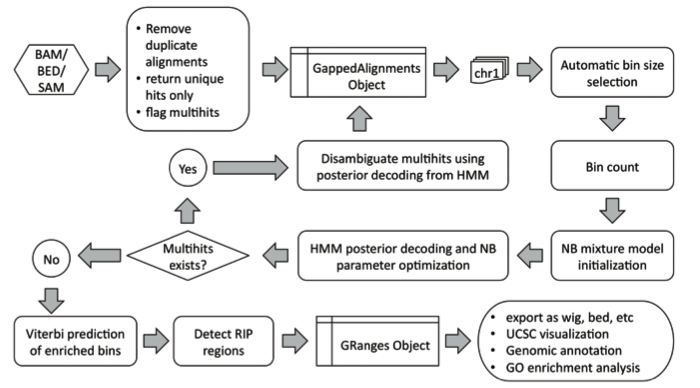
RIPSeeker
RIPSeeker is a relatively new tool that uses a Hidden Markov Model to identify regions that are probably bound by a protein. It does this by using a two-state model (bound region or not-bound region), and finds the maximum-likelihood state sequence of each chromosome, where a state is assigned to a block of sequence of a pre-determined length (called bin size). The workflow of RIPSeeker is as follows:
Li Y, Zhao DY, Greenblatt JF, Zhang Z. RIPSeeker: a statistical package for identifying protein-associated transcripts from RIP-seq experiments. Nucleic Acids Res. 2013;41(8):e94.
PARalyzer
While we will not use it today (because it is very tricky to run at TACC), PARalyzer is by far the most popular PARCLIP-specific software being used to analyze PAR-CLIP data. To understand what it does (and you can download it here if you are interested in playing with it yourself) it is helpful to look at the parameters it evaluates:
*****Required Options:
BANDWIDTH=#integer# = Size of bandwidth for KDE calculation (default 3)

CONVERSION=#character from#>#character to#
#character from# = Character representing the modified ribonucleotide (default 'T')
#character to# = Character representing what the modified ribonucleotide is read as by rTranscriptase (default 'C')
note: only 1 conversion is possible at this time; in the future we may implement the ability to have 2 modified ribonucleotides

MINIMUM_READ_COUNT_PER_GROUP=#integer# = Minimum number of reads required to call a group (default 10)

MINIMUM_READ_COUNT_PER_CLUSTER=#integer# = Minimum number of reads required to call a cluster (default 1)

MINIMUM_READ_COUNT_FOR_KDE=#integer# = Minimum read depth at a location to make a KDE estimate (default 1) => (recommended: 5)

MINIMUM_CLUSTER_SIZE=#integer# = Minimum length required for a cluster to be reported (default 1)

MINIMUM_CONVERSION_LOCATIONS_FOR_CLUSTER=#integer# = Minimum number of separate locations to have a reported conversion for a cluster to be reported (default 1) => (recommended: 2)
note: setting this to 0 will cause errors, if you are looking for sites that may have no conversions, I recommended analyzing the 'groups' output file (see below)

MINIMUM_CONVERSION_COUNT_FOR_CLUSTER=#integer# = Minimum number of conversion events within a region to report a cluster (default 1)
note: setting this to 0 will cause errors, if you are looking for sites that may have no conversions, I recommended analyzing the 'groups' output file (see below)

MINIMUM_READ_COUNT_FOR_CLUSTER_INCLUSION=#integer# = Minimum read depth for a location to be included within a cluster (default 1)

MINIMUM_READ_LENGTH=#integer# = Minimum length of mapped read to be included in the analysis (default 1)

MAXIMUM_NUMBER_OF_NON_CONVERSION_MISMATCHES=#integer# = Maximum number of non-conversion mismatches of a mapped read to be included in the analysis (default 5)

BOWTIE_FILE=#filepath/filename# = Location and name of a bowtie output file to be analyzed
note: there can be multiple BOWTIE alignment files used as input, just create a new line with a new 'BOWTIE_FILE=' parameter

GENOME_2BIT_FILE=#filepath/filename# = Location of the UCSC .2bit file of the genome against which the reads were aligned

OUTPUT_CLUSTERS_FILE=#filepath/filename# = Location and name of the resulting clusters file
Corcoran DL, Georgiev S, Mukherjee N, et al. PARalyzer: definition of RNA binding sites from PAR-CLIP short-read sequence data. Genome Biol. 2011;12(8):R79.
This is a lot of parameters, but what should be clear is that there is no test being performed at all, but instead a set of loci identified based on certain mutation-based characteristics. Then, the read shape at those loci is modeled by a process known as Gaussian kernel smoothing. Usefully, this program can be extended to many mutations or sequence-altering protocols. It is probably the best way to sift out coordinates where point mutations are a guide to peak selection.
Other Online Tools
This is not an exhaustive list, but there are many other places you can go to analyze RIP-seq data, particularly CLIP-seq or PAR-CLIP.
- ASPeak - a really interesting, but EXTREMELY new (~ 7 months) R package; incorporates RNA-seq, mock IP, and real IP data
- PIPE-CLIP - a Galaxy-based tool for CLIP-seq analysis; you upload your files to their served, and get enriched regions (peaks) in return
- CLIPZ - a GUI for end-to-end pipeline analysis of CLIP-seq data; it uses BWA and an internal algorithm to identify binding sites and perform motif analysis
- dCLIP and PARCLIP-HMM - MATLAB based packages for analyzing any "footprinted" RIP-seq data; they have a lot of overlap with other tools
- PARma - a tool designed 100% for microRNA-Ago2 PAR-CLIP experiment seed identification
As you can see, the field is pretty active, with tools ranging from peak identification within certain constraints up to formal statistical testing and integration of other sources of information such as native RNA abundance and miRNA seed sequences.