Sanger Sequencing Troubleshooting Guide
|
Two options to view your results for troubleshooting:- View the table from "Download DNA Results" within the Coreweb LIMS system to see summary data including Phred Q20 length and Phred signal intensity, or to view your raw sequence chromatogram ("View"):
 - To compare your samples to others on the same run, enter your plate or order number here to compare your sequence Q20 length, signal intensity, and average Quality Value to other samples run at the same time including the DSF's internal control.
From either of these views, interpret results as follows:- Look at the Phred Q20 length and Phred Signal Intensity:
- Plasmid sequences with good quality will have the Q20 lengths over 800 bp depending on the type of template.
- PCR product sequences will have Q20 lengths of 20 to 50 bp lower than the product length.
- Look at the Phred Signal Intensity:
- Good signal intensities will be between 500 and 4000.
- Signal intensities below 100 are background or close to background and not reliable sequence.
- Signal intensities above 4000 have too much DNA in the sequencing reaction, and will cause errors in basecalling.
- Compare your chromatograms to the examples below for further details.
Quantifying your DNA is key:- Quantify your DNA using the UV/Vis (NanoDrop) or fluorescent quantification (PicoGreen or Sybr Green)
- UV/Vis Quantification
- The NanoDrop has a reliable lower limit of detection (LLD) of about 10ng/ul - readings below this are often NOT reliable.
- Contaminants like RNA, genomic DNA, and salts can over-estimate the concentration of DNA because they absorb at or around 260 nm.
- Good quality DNA should have A260/280 ratios around 1.8 to 2.0. Lower ratios indicate the presence of contaminants like protein and phenol that absorb at 280 nm.
- Good quality DNA should have A260/230 ratios around 1.8. Lower ratios indicate the presence of organic contaminants like salts, TRIzol, EB, EDTA, and carbohydrates.
- You may not be able to quantify PCR products due to detection limits with UV/Vis (quantities less than 10 ng/ul are not reliable on NanoDrop). If you purify your PCR products prior to Sanger sequencing: ensure that any primers leftover from the PCR reaction, unincorporated nucleotides, enzyme, buffer, and salts are completely removed. When using EtOH precipitation, make sure to remove any residual ethanol; EtOH can bind to unincorporated dyes in the sequencing reaction which can lead to dye blobs and basecalling errors. Gel-purified PCR products that produce a single band will produce the best sequencing results.
- Fluorescent Quantification - e.g. PicoGreen assays, Invitrogen Qubit assay
- Contaminants are less likely to affect quantification
- Better for PCR product quantification (lower limits in pg range)
|
Quantification Examples:UV/Vis (NanoDrop):

Good UV/Vis from NanoDrop: 260/280=1.87 and 260/230=2.19 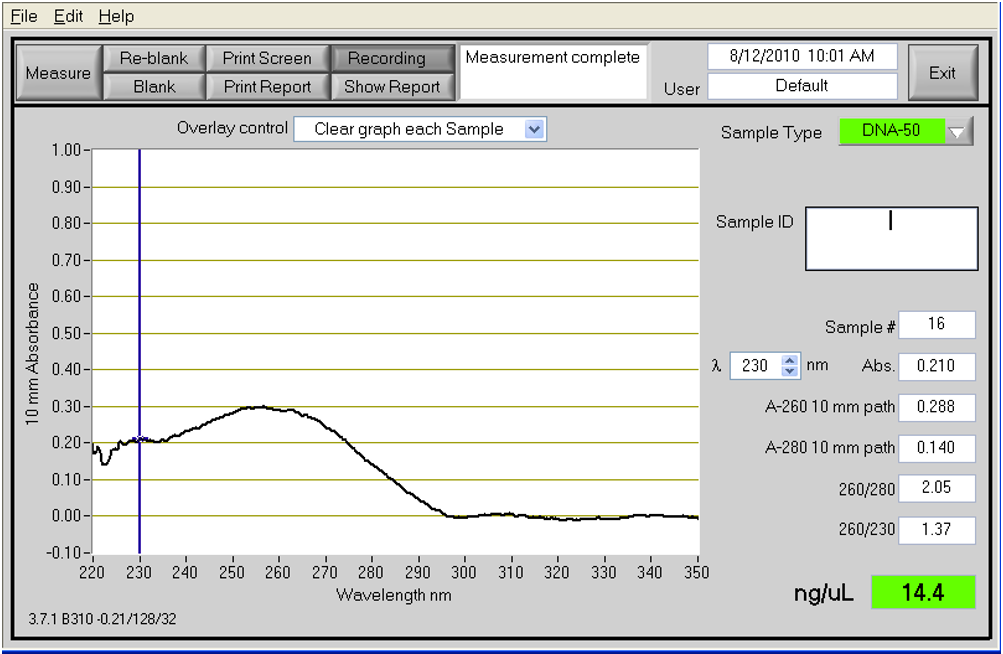
Example of PCR product on the NanoDrop 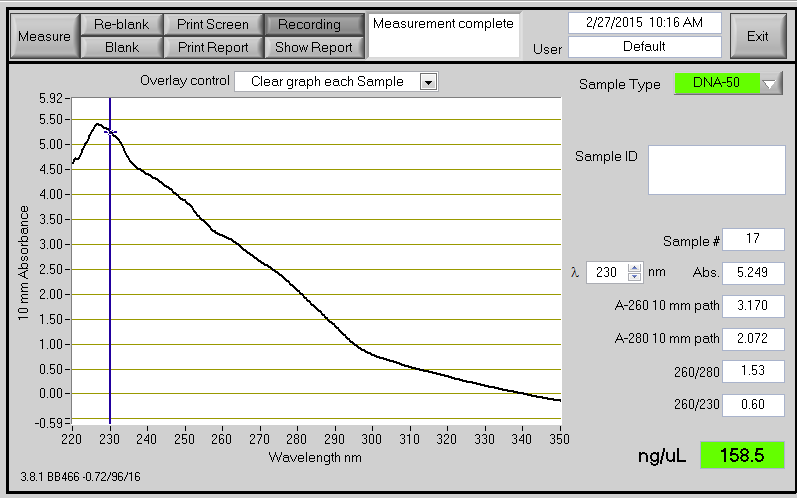 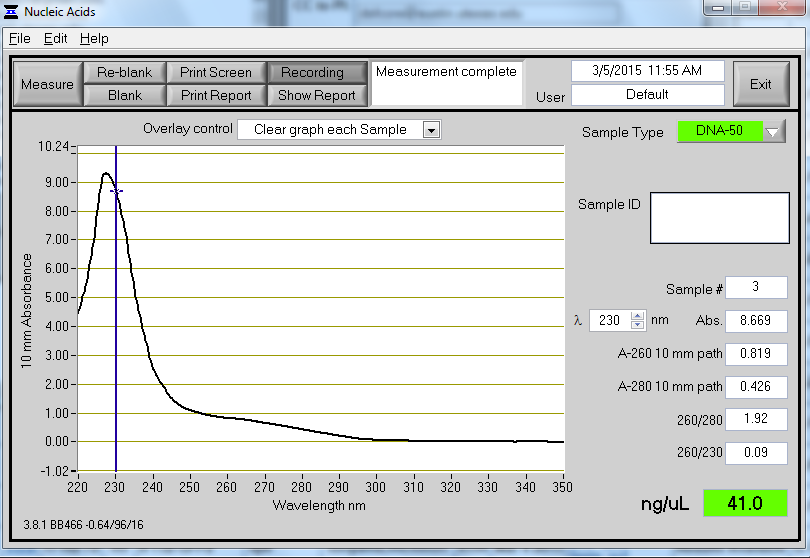
Poor UV/Vis from NanoDrop A contaminant is present in the samples. In some cases this can cause the NanoDrop to overestimate the concentration of DNA (e.g. A260/280 = 1.53, A260/230 = 0.60, conc.= 158.5 ng/ul). Quantification Using SYBR Green.docx
|
Q20 Scores:
|
No Sequence or Not enough DNA or low DNA  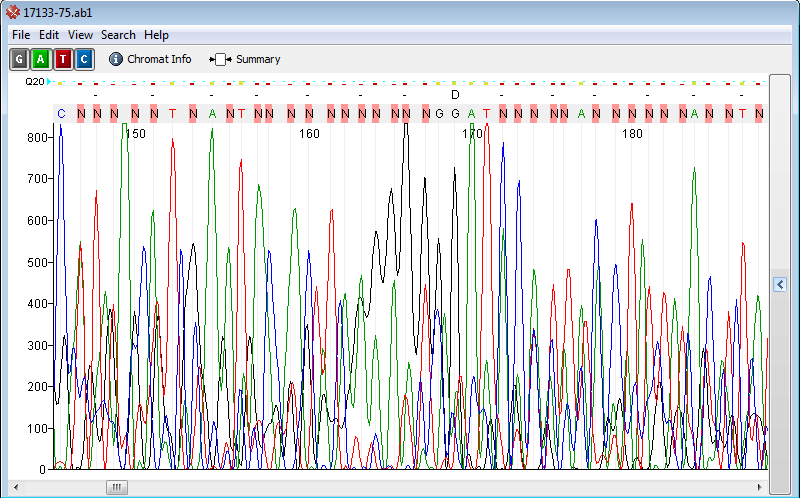
Possible Causes: - Not enough DNA
- Primer mismatch
- Priming site is absent or has a mutation
- Contamination
- Poor quality template, vector, or primer
Treatment: - Use more DNA or re-perform the miniprep
- Increase the number of cycles for the PCR reaction
Remake primers - Check and make sure the priming site is there
- Purchase new primers
- Make sure your sample submission has the correct request for primers
|
Too Much DNA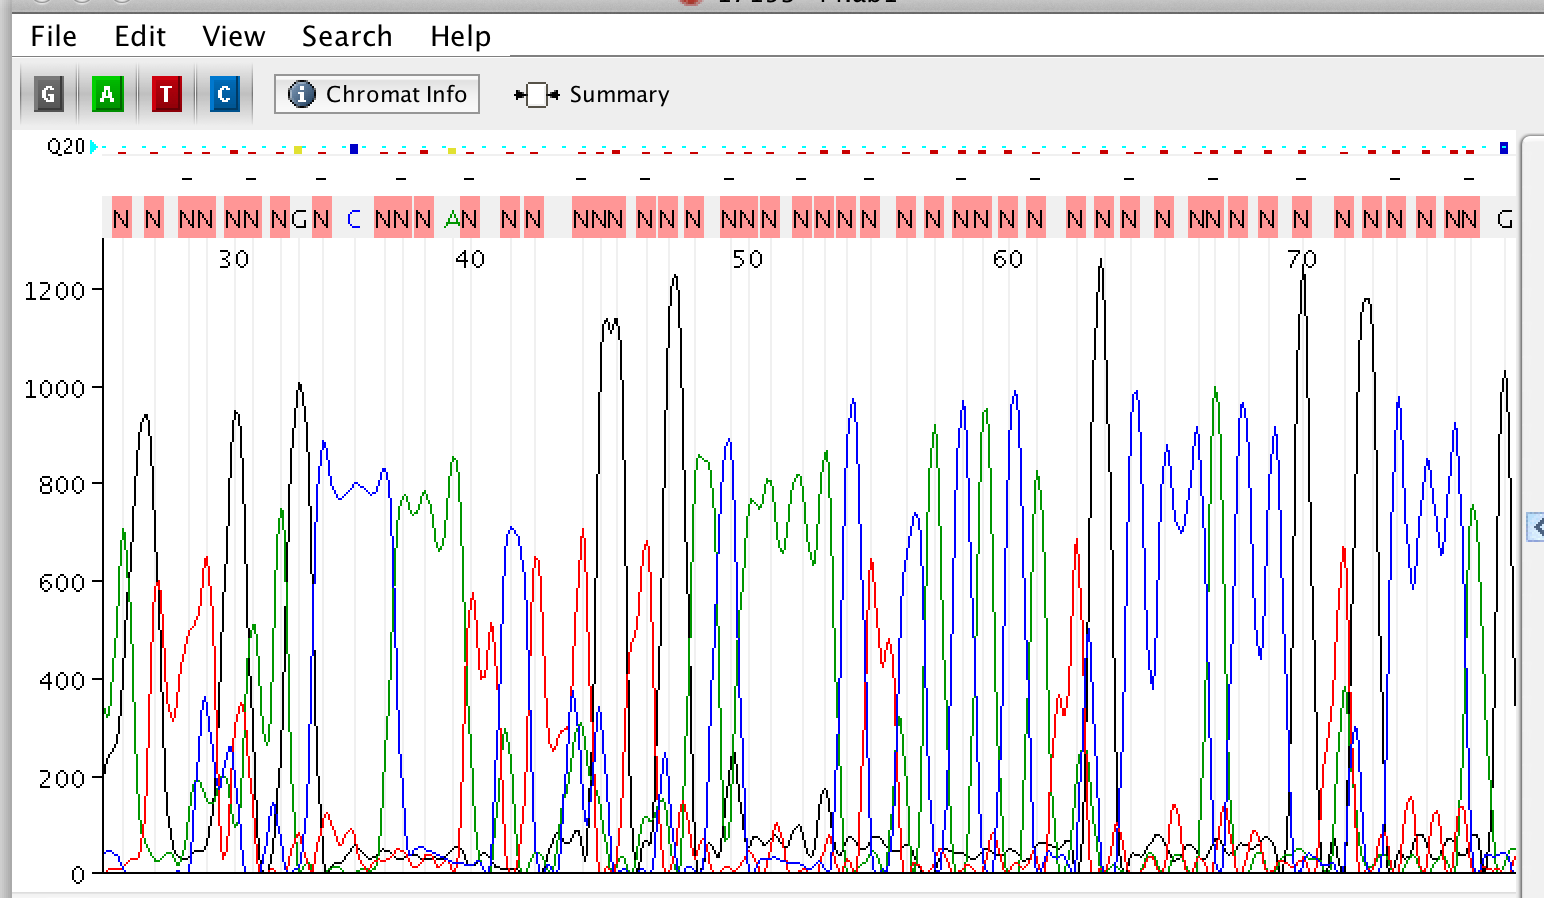 
Possible Causes: Treatment: - Quantify samples (We recommend 15 to 30 ng/ul for a 5 kb plasmid).
- Dilute your samples
|
Mixed product or Double Sequence 
Possible Causes: - Multiple colonies or clones present during sample prep
- Multiple PCR products
- Multiple priming sites/Non-specific primer binding
- Primer-Template mismatch
- Contamination from water or environment
Treatment: - Try a universal primer in the plasmid for verification
- re-pick colony with less dense cells
- Try another primer
- Redesign primers
|
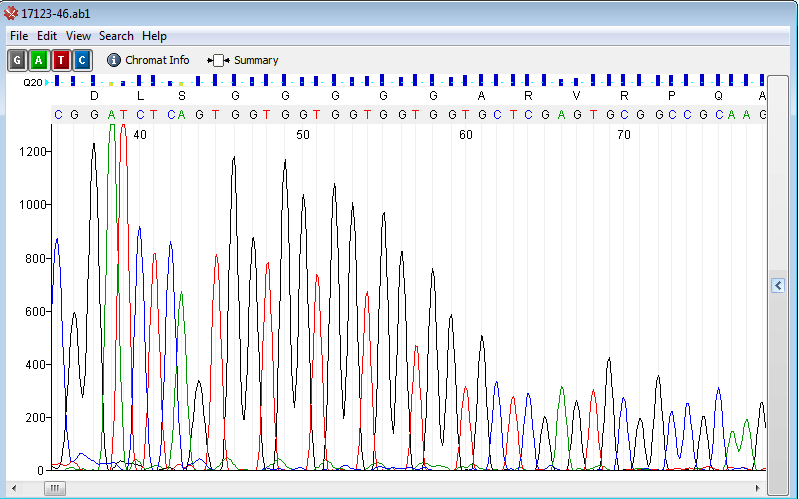
Contaminant - Top Heavy or Ski Slope effect 
Possible Causes: - Most Often: Too much DNA
- High Salt concentration
- Salt or Ethanol contamination
- Excess primer
- EDTA or EB concentration too high
Treatment: - Quantitate DNA samples
- If DNA is obtained by gel extraction, perform an extra wash
- Spin filter tube longer
- Dry spin column longer
- Re-precipitate DNA and perform an 80% Ethanol wash
- Elute with water
|
Secondary Structure - Mid Sequence Drop off or Hard Stop
Possible Causes: - Secondary Structures (Hairpins, stem loops, palindromes)
- shRNA region, RNAi region
- GC rich region
Treatment: - Sequence from the other direction or closer to the region
- Request GC Rich or HSP service types
- Linearize DNA
- Shear DNA
|
| |
Artifacts   Possible Causes: - Bad injection
- Inhibitory contaminant
- Dye Blobs
Treatment: - Request difficult template buffer in your DSF order
- Dilute samples
- Rerun the samples
|
Short sequence - Primer Dimer
Possible Causes: - Inefficient primer design
- Priming site's not there
- Primer hybridizing to itself
Treatment: - Design new primers
- Double check primers for palindromes
- Ensure the last 5-6 nucleotide at the 3' end won't anneal to another region
|
Repeats or homo polymer
Possible Causes: - High GC rich template
- Repeat region
- Polymerase is slipping
- Long stretches of homopolymer regions
Treatment: - Request GC Rich service types
- Sequence in the opposite direction
- Use a primer that anneals at a different position
|
Additional Troubleshooting Resources:http://www.nucleics.com/DNA_sequencing_support/DNA-sequencing-troubleshooting.html http://dnasequencingcore.ucdenver.edu/pdf-Files/DNA%20Sequencing%20Troubleshooting%20Guide.pdf 3730 & 3730XL DNA Analyzers Sequencing Chemistry Guide.pdf Automated DNA Sequencing Chemistry Guide.pdf Automated DNA Sequencing Chemistry Guide.pdf |
| |

Here is an example of samples that had RNA contamination. It is always a good idea to run samples on a gel or BioAnalyzer for optimization. |
| |