...
- This graph can not be interpreted by somebody with Monochromacy / Achromatopsia, nor when printed in grayscale.

- This graph uses shapes in addition to color to convey the information. It can be interpreted in grayscale and by somebody with Monochromacy / Achromatopsia.


Bar Charts
Even if you are color coding, make sure values or labels are included with each bar for screenreaders. If the color differences are significant to understanding the chart, make sure that they have sufficient color contrast and difference in darkness for a colorblind user to interpret.
The below bar chart could use editing for improvement of contrast in color depth in order to be interpreted by a person with monochromacy:
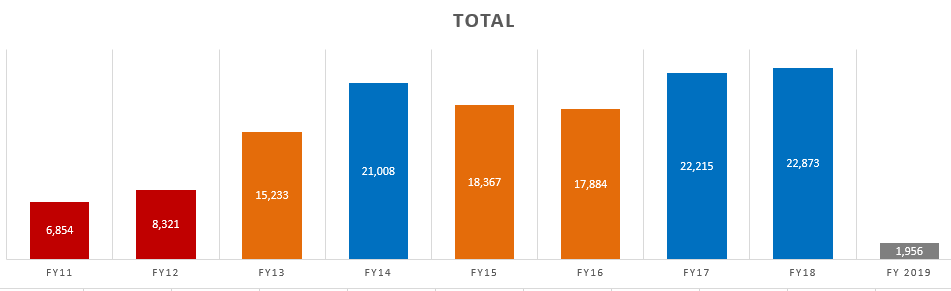
- Checked in
 (Checked on the Coblis free online colorblindness simulator.)