QuantStudio Software Download
QuantStudio Software v1.3 can be downloaded for PC from ThermoFisher HERE. The data analysis features do not require a license. Now you can analyze data on your own computer!
Starting a Run
- Open the QuantStudio Real-Time PCR software and in the Set Up box select "Experiment Setup" to start a new experiment or select "Template" to load a saved template
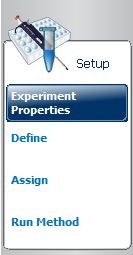
- Under "Experiment Properties", select the major experiment parameters, such as block and reagents
- Please note: The Fast 96-Well block works with BOTH fast and standard chemistry
- Please keep the date when naming your experiment
- Please note: You DON'T have to "Define" your targets or "Assign" your wells in Setup until AFTER the data has been collected. The instrument will automatically collect data across the entire spectrum from all wells.
- Under "Run Method", adjust the reaction volume and number of cycles (defaults are 20 uL and 40 cycles). The default SYBR Green method is based on manufacturer specifications.
- If necessary, you can add/remove stages or steps to/from the method. To save a Run Method as a template, go to Save > Save As Template > qPCR User Data > [Your Folder] (Please DON'T use "Save Run Method").
- When ready to run, select "Run" on the Experiment Menu at left. Next, click the green "Start Run" button, which will open a dropdown menu showing ViiA7 A, B, and C. Select your instrument. You will then be prompted to save your experiment file before the run begins.
- Close the software, log off the computer, and go into the ViiA-7 room and wait at least 5 minutes to ensure the instrument doesn’t abort the run (unlikely)
The "Home" screen 

The "Experiment Menu"

Collecting Your Data
- In the Run box of the Home screen, select "Instrument Console", then double-click the instrument that ran the experiment (ViiA 7 A, B, or C) to access its hard drive
- On the left side menu, click the "Manage Files" button
- In the “Completed Experiments” folder, scroll down to your file (files are listed by date, most recent at the bottom). Your run should say (Not Collected).
- Highlight your run and click “Download”. You will be prompted to save your file. Save your file to qPCR User Data > [Your Folder] > [Your Filename]
Analyzing Your Data
- In the Analyze box of the Home screen, select "Analyze Experiment". You will be prompted to open a saved .eds file. Navigate to qPCR User Data > [Your Folder] > [Your Filename] and open it.
- To view your results, select the Setup button in the menu at left and go to "Assign". On the plate map, highlight all the wells containing samples, then check the box under "Targets" at left to assign samples to wells.
- Next, select "Analysis" on the Experiment Menu. Near the top right of the screen there is a green "Analyze" button. Click it to initiate analysis.
Exporting Your Data
Most users just want their CT values. Here are the instructions for acquiring the CT data and exporting it in Excel format.
- To acquire CT values, select Export on the Experiment Menu. This will yield a page with a set of data tabs. The primary data of interest is in the "Results" tab. Thus, check the "Results" tab box and uncheck all the others.
- The "Results" tab has 30+ fields of data. Check only the boxes representing data you want to export (such as "CT", "Ct Mean", and "Ct SD").
- Before export, browse for Export File Location and enter your Export File Name in the relevant field. Then, use the dropdown menu to choose File Type (.xls, .xlsx, .txt).
- In the top right corner, click the blue Export button. The file will automatically download to the specified destination. Save the file to a flash drive or email it to yourself.